
Garden weather wheel

The natural rhythms of weather, temperature, and moon phases are deeply connected to the garden, influencing what grows and thrives in each season. Tracking these patterns helps us become more informed and intentional gardeners, making it a valuable addition to a garden journal.
In my own journal, I’ve been experimenting with different ways to record this information. I first tried a table format, which captured the data well but wasn’t very visually engaging. Inspired by Miriam Morrill from Pyrosketchology, I began using a wheel format with a colour-coding system to create a striking visual representation of temperature fluctuations over the month. This method makes the data more dynamic and easy to interpret.
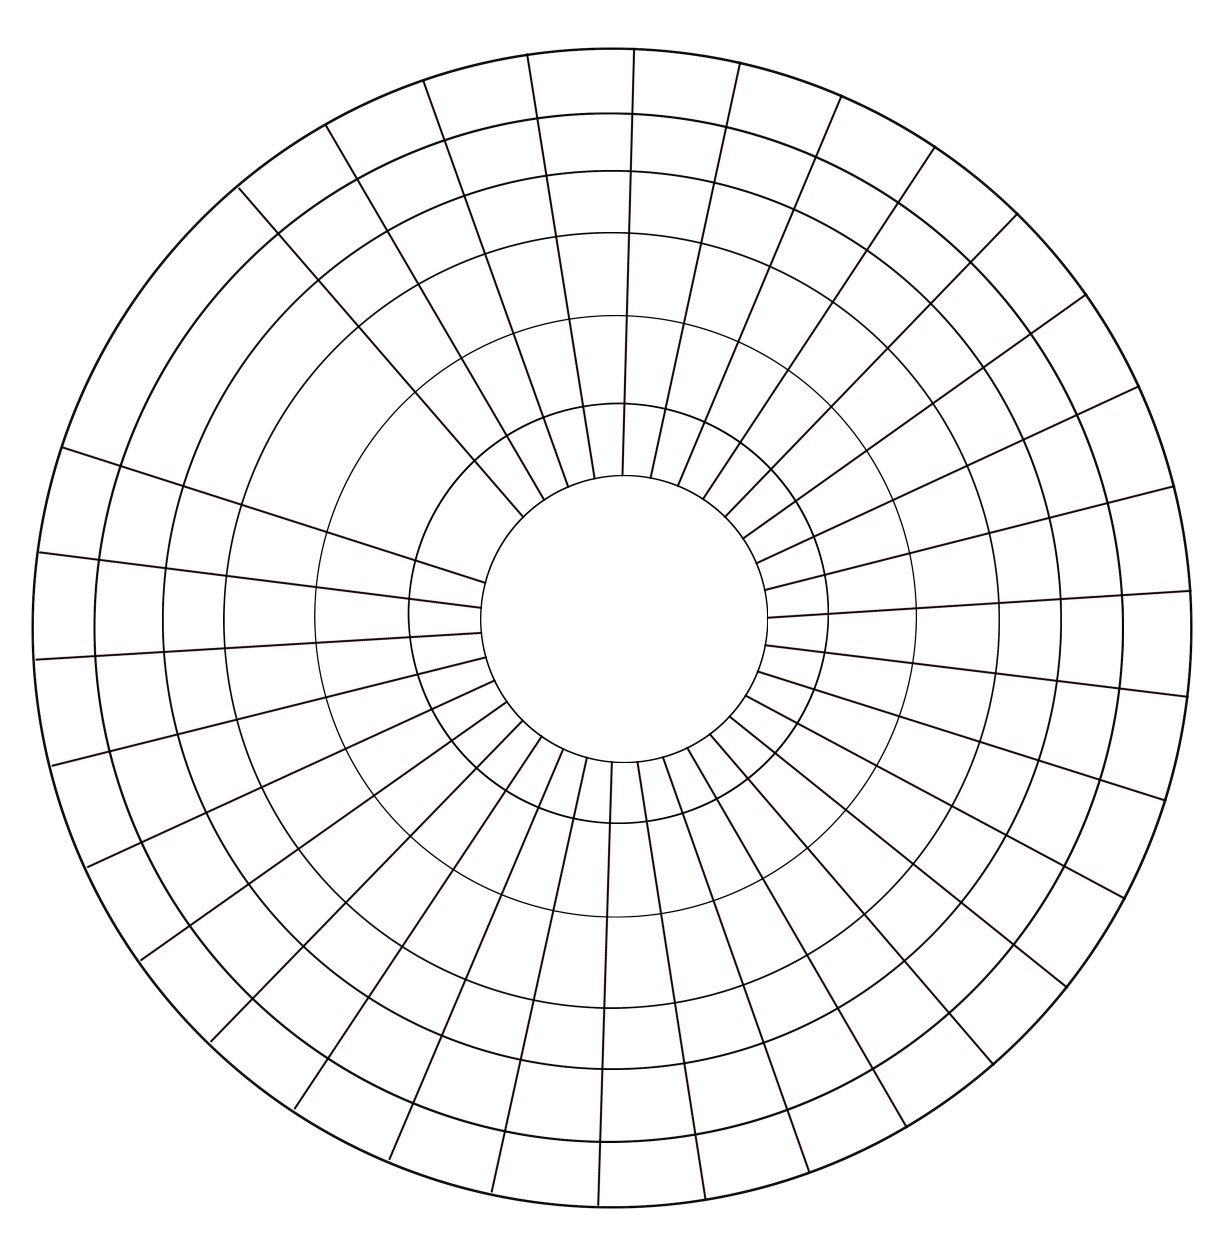
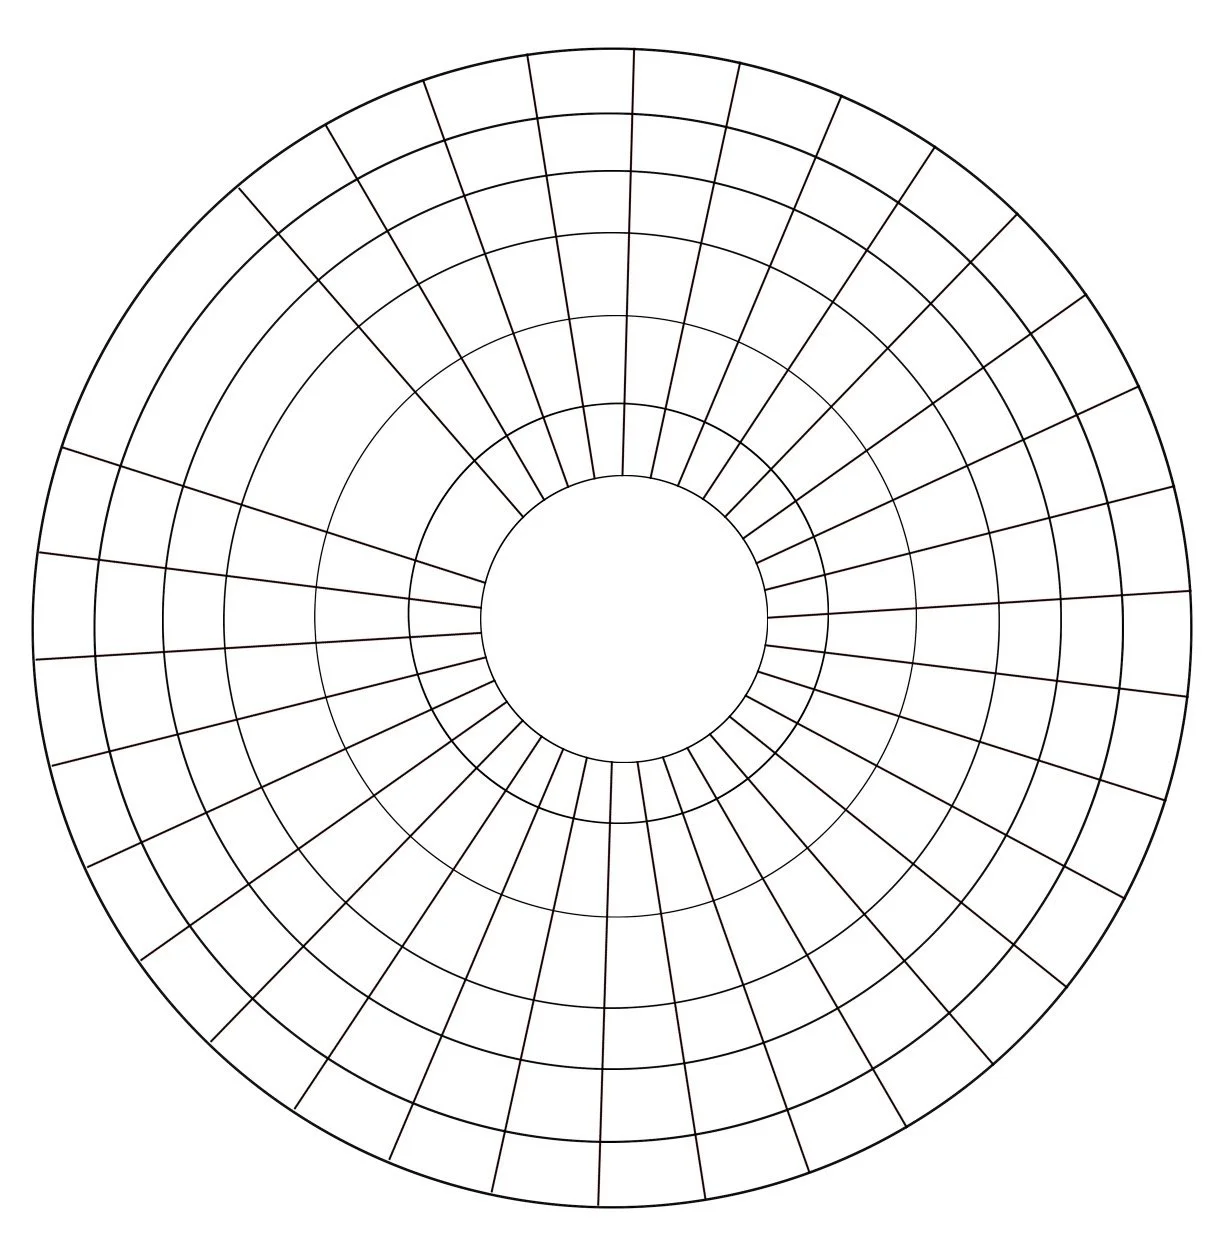
Each month, I draw a new wheel in my journal, adding labels and a key. Then, using daily temperature readings from my local weather station, I fill in the data. Here’s how it looks when a month is complete:

If you would like to use this method to capture weather data in your own garden journal, I’ve prepared a template that you can print and either trace or paste into your journal. There are two sizes. The smaller template will fit onto an A4 journal page. The larger one can be stretched across the middle of two pages of a journal, creating a double-page spread.
I am interested to know about different ways that you record this kind of weather information. Please leave a comment below and let me know your own methods!